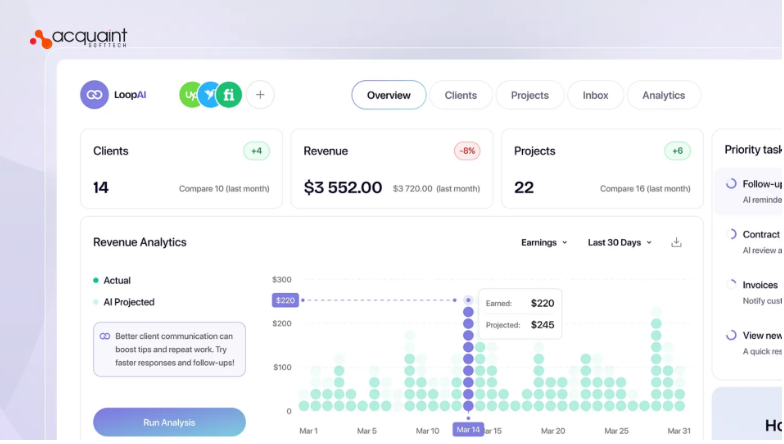
Your dashboard says signups are up and onboarding-tour completion is high, yet trials still are not converting. That is because those are vanity metrics; the number that predicts revenue is whether new users hit their aha moment, the instant your product’s value clicks.
At Acquaint Softtech, our team and I build the instrumentation that finds and measures that moment. Defining it is as much a software product development decision as a marketing one.
Most teams guess at their aha moment or track whatever is easy to count, then wonder why activation stays flat. Finding it is a measurement problem: you correlate specific in-app actions with who sticks around, which calls for sound analysis, not a hunch. The US government’s statistical methods handbook exists for exactly that: choosing the right analysis and interpreting the result correctly. Vanity metrics tell you nothing about value.
This article covers what the aha moment is, how to define it with behavioral cohort analysis, the five activation metrics to measure, how to instrument them, how to improve your rate, cost, and a real case study. It pairs with our wider SaaS product development guide. Read on, then measure what actually matters.
Why Teams Measure the Wrong Things
It is easy to count signups, logins, and tour completions, so that is what most dashboards show, but none of them tells you whether a user found value. Optimizing those numbers can even hurt, because a higher signup count with the same activation rate just means more people churning. Tying measurement to real value is a virtual CTO services concern as much as a marketing one.
What is a vanity metric, and why is it dangerous?
A vanity metric looks good and moves easily, but does not predict retention or revenue, like completing a signup form or logging in once. It is dangerous because it creates a false sense of progress and hides the real problem: users who never reach value. Replacing those metrics with meaningful ones takes capacity, which is where IT staff augmentation services help.
Why is activation a 2026 priority?
With product-led growth, the free trial does the selling, so activation is the single lever that most affects conversion and retention, and small gains compound across every cohort. Owning that measurement and acting on it suits a dedicated software development team working with growth.
What Is the Aha Moment?
The aha moment is the pivotal instant a new user first realizes your product’s core value, the point where it goes from another tab to something worth paying for. It is the bridge between acquisition and retention, and activation is simply the measure of how many users cross it. Even a content product on hire WordPress developers has one: the moment a reader sees the value of subscribing.
What does an aha moment look like in practice?
It is always a specific, value-producing action, not a generic step. For an email tool, it is sending the first newsletter; for project management software, it is creating a board, adding tasks, and inviting a teammate; for cloud storage, it is uploading and sharing the first file. A store on hired WooCommerce developers might define it as a shopper completing a first successful order.
What are the benefits and 2026 trends?
Knowing your aha moment lets you redesign onboarding around one clear goal, which lifts conversion and retention together. The 2026 trend is AI that helps discover the activation action automatically and predict which users will reach it. Pinning down that moment before building is what a product discovery workshop is for.
Does every product have just one aha moment?
Usually one primary aha moment per core use case, but larger products often have several, one per persona or job to be done. A project tool’s aha moment for a team lead, who sees value when work becomes visible across the team, differs from an individual contributor’s, who feels it when a task is captured in seconds.
The discipline is not to force a single moment onto everyone; it is to define the right activation event for each major segment and measure them separately. Collapsing different users into one number hides exactly the friction you are trying to find, which is why segmentation matters as much as the metric itself.
How to Define Your Aha Moment
You define the aha moment with behavioral cohort analysis, not intuition: group users by which early actions they took, then see which action most strongly separates the users who stay from the users who churn. That action is your aha moment. The analysis behind it frequently involves hiring Python developers with a data background.
How does behavioral cohort analysis work?
You look at retained users versus churned users and compare what each group did in their first days, then find the action whose presence most reliably predicts retention. That correlation, validated across enough users, is far more trustworthy than a guess. Capturing the events that feed it is work for hire for Laravel developers on the backend.
Why not just use the first login or sign up?
Because those happen to everyone, including the users who immediately leave, so they carry no signal about value. A real aha moment is an action only engaged users take, which is why it predicts retention. Instrumenting the product to capture those precise actions suits MERN stack developers.
How much data do you need to trust the result?
Enough that the pattern is not noise. With only a few dozen users, one or two outliers can make any action look predictive, so an aha moment defined on a tiny cohort is little better than a guess. As a rough rule, you want hundreds of users across both the retained and churned groups before you lean on a correlation, and you want to confirm it holds across more than one time period rather than a single lucky week.
This is where treating activation as a measurement problem pays off: the same care a statistician would apply, sufficient sample size, stable definitions, and a check that the relationship repeats, is what separates a real aha moment from a coincidence you will chase for a quarter.
The Five Activation Metrics to Measure
Once you know your aha moment, five metrics tell you how well users reach it. Activation rate is the number of users who complete your activation event divided by total signups, times 100, measured within a set window, such as seven days. The infrastructure that records these events reliably is the DevOps engineers territory.
| Metric | What it measures | Why it matters |
| Activation rate | Percent of signups who hit the activation event | The headline measure of onboarding |
| Time to value | Time from signup to first value | Faster TTV lifts trial-to-paid conversion |
| Core action rate | How often do users perform the key action early | Shows the value of forming habits |
| Onboarding completion | Percent finishing setup and walkthroughs | Flags where the flow loses people |
| Early retention | Percent returning at day 7 and day 30 | Confirms the aha moment actually stuck |
What is a good activation rate?
It varies by model, so compare yourself to your category, not a universal number. Self-serve, product-led products average roughly 30 to 45 percent, and anything under 20 percent usually signals serious onboarding friction; sales-led enterprise products run higher, often 60 to 85 percent, because customer success managers guide users to value. Building the pipelines that compute these reliably suits Django developers.
Which metric should you start with?
Start with activation rate and time to value, because together they tell you how many users reach value and how quickly, the two numbers most tied to conversion. Add the others as your tracking matures. Keeping these definitions stable as the product changes is a kind of discipline applied to analytics, similar to software version upgrade services.
How to Instrument and Measure Activation
Measuring activation means instrumenting the product to record the right events, storing that behavioral data, analyzing it to find and track the aha moment, and surfacing the result on a dashboard that the team watches. That loop turns a definition into a number you can move. Predicting which users will activate, from early behavior, is a fit for AI development services.
What do you actually instrument?
You track the specific actions that make up and lead to your activation event, captured as events with the user, the action, and a timestamp, using a behavioral analytics layer rather than guessing from page views. Models that score activation likelihood from those events can be built by hiring AI/ML engineers.
Should you track everything or just a few events?
Track deliberately, not exhaustively. It is tempting to instrument every click on the theory that more data is always better, but a sprawl of poorly named events quickly becomes unusable, and nobody trusts a dashboard built on it.
The stronger approach is to define the handful of events that make up and lead to your activation event, name them with a clear convention, and document what each one means, then expand only when a real question demands it.
A small, well-governed event set that the whole team understands beats thousands of ad hoc events that take a data analyst an afternoon to untangle every time someone asks a simple question about activation.
How do you keep the measurement trustworthy?
Events drift as the product changes, definitions get fuzzy, and dashboards quietly break, so activation tracking needs ongoing validation and upkeep rather than a one-time setup. Keeping the numbers honest is a software support and maintenance services commitment.
How to Improve Activation: Tactics, Cost, and Stack
Improving activation means removing friction between signup and value: streamline the signup, guide the first session, and personalize the path to the aha moment. Then measure whether each change moved the rate. Delivering this instrumentation and the onboarding changes affordably is core software development outsourcing work.
What are the highest-impact tactics?
• Streamline signup: ask only for essentials and offer single sign-on or social login.
• Use in-app checklists, progress bars, and contextual tooltips to guide the first session.
• Personalize the flow by the user’s role, goals, or plan, so the fastest path to value is the default.
Building these guided, personalized flows often involves hiring MEAN stack developers on the application side.
How much does it cost, and what stack is best?
Basic instrumentation with an activation dashboard is a few weeks; a full pipeline with cohort analysis, prediction, and personalization takes longer, and India-based teams deliver it at up to 40% lower cost.
A common stack pairs an event-tracking layer with an events store, Python for cohort and retention analysis, and a dashboard; a mobile app, by hiring React Native developers, emits the same events as the web app.
| Layer | Recommended Tech | Role |
| Event tracking | An event-tracking layer in the app | Capture the actions that signal value |
| Store | An events store or warehouse | Hold behavioral data for analysis |
| Analysis | Cohort and retention analysis in Python | Find the action that predicts retention |
| Dashboard | An activation dashboard | Monitor rate, TTV, and retention |
| Feedback | Hooks back into onboarding | Act on what the metrics reveal |
Real Case Study: Turning Behavior Into a Clear Signal
Activation measurement comes down to one move: instrument behavior, turn it into a clear signal of who is engaged and valuable, and surface that signal so the team acts on it. BUTAS TAU, a long-established real-estate firm, needed exactly that for its flood of incoming inquiries, which agents had been sorting by hand.
This was an AI lead-qualification platform rather than a SaaS activation system, but the engine is identical, which is why it belongs here. Steering a data build like this on milestones is where a technical project manager keeps scope and results aligned.
- All incoming inquiries: Leads arrive from many channels, mixed in intent and quality.
- Scored by behavior: A behavioral model ranks each lead by intent and urgency.
- High-intent, acted on first: Sales focuses on the buyers most likely to convert.
Acquaint built the behavioral scoring model and a central dashboard that read each lead’s activity, scored it, and surfaced the most promising buyers first, the same instrument-then-act loop that activation measurement applies to trial users. More builds sit on our case studies page.
Teams building activation analytics and behavioral scoring often hire remote developers with data and product analytics experience.
See also: The Peptide and the Package: Two Different Questions About Thymulin
FAQs
What are SaaS activation metrics?
They measure whether new users reach their aha moment, the point where they first experience the core value. The key metrics are activation rate, time to value, core action rate, onboarding completion, and early retention.
What is the aha moment in SaaS?
It is the pivotal instant a new user first realizes the product’s core value, a specific value-producing action such as sending a first newsletter or sharing a first file, not a generic step like logging in.
How do you define your aha moment?
Through behavioral cohort analysis: compare what retained users did early against what churned users did, and find the action that most strongly predicts retention. That action is your aha moment.
How do you calculate activation rate?
Activation rate is the number of users who complete your activation event divided by total signups, times 100, measured within a set window, such as seven days.
What is a good activation rate?
It varies by model. Self-serve, product-led products average around 30 to 45 percent, with under 20 percent signaling friction; sales-led enterprise products often reach 60 to 85 percent with customer success support.
How much does it cost to build activation tracking?
Basic instrumentation with a dashboard takes a few weeks; a full pipeline with cohort analysis and prediction takes longer. India-based teams deliver it at up to 40% lower cost.
What tech stack is best for SaaS activation tracking?
An event-tracking layer in the app, an events store or warehouse, Python for cohort and retention analysis, and a dashboard that monitors activation rate, time to value, and retention.